Technical Skills
- Data Analysis & Statistics
- Data Science & Analysis
- Data Engineering & Modelling
- Machine Learning
- Business Intelligence
- Geographic Information Systems
- Artificial Intelligence Applications
- Programming
Hello, I’m
Statistician & Data Enthusiast
I am a Bachelor of Statistics graduate from the Islamic University of Indonesia with a specialization in Data Science and Machine Learning, and certified by BNSP as a Data Analyst. As a Data Enthusiast, I always keep up with technological developments and continuously develop my skills in statistical analysis, machine learning, data science, as well as Artificial Intelligence. I am interested in understanding how data can provide answers to various problems and support better decision-making through accurate and relevant analysis.
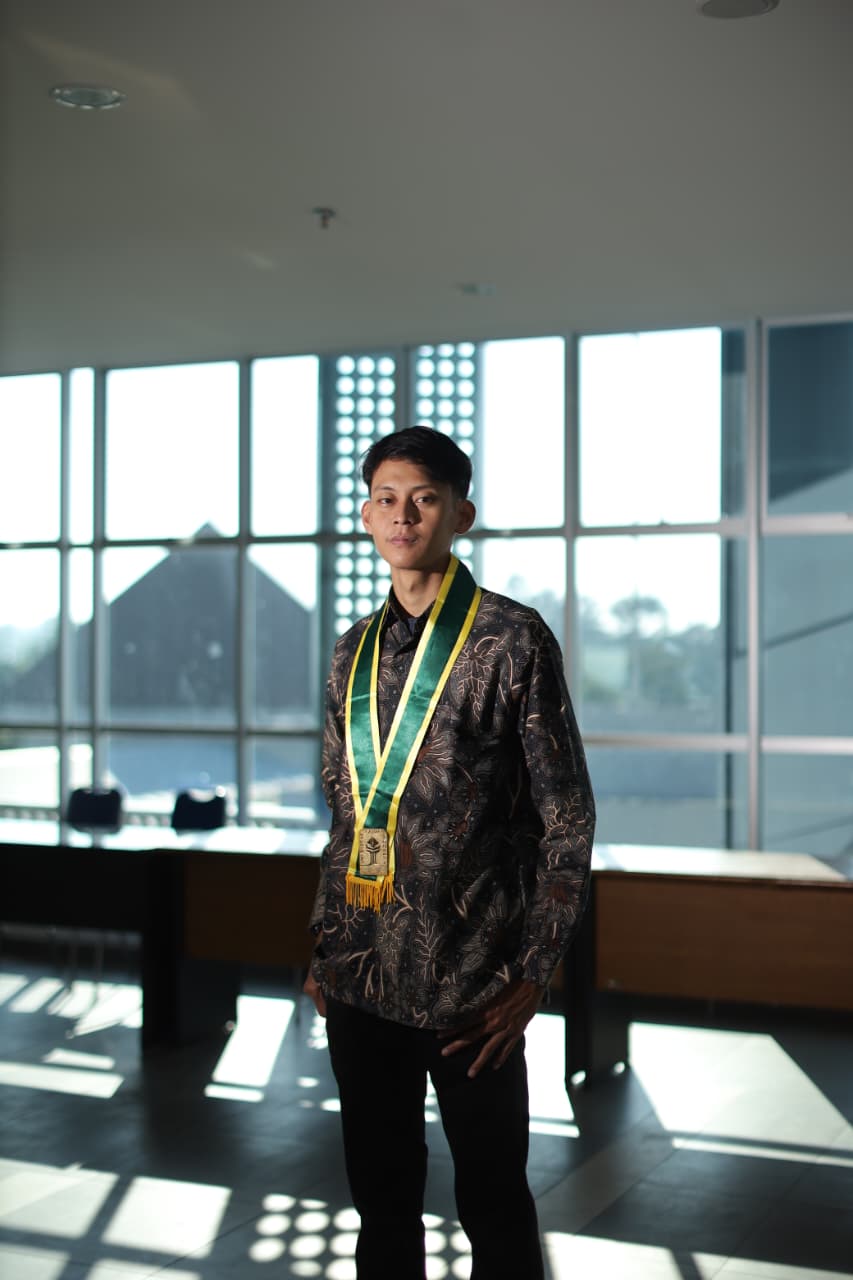

Graduated February 2026
Universitas Islam Indonesia
During my studies, I studied applied statistical modelling, data science, machine learning, data engineering, and artificial intelligence for data analysis. Alongside my academic pursuits, I actively participated in extracurricular activities, particularly by serving on various organizing committees. These organizational experiences played an important role in developing my soft skills, especially teamwork, effective communication, and problem-solving.

Tuberculosis Risk Factor Analysis Using Logistic Regression with a Complex Survey Design and Missing Data Handling
View publication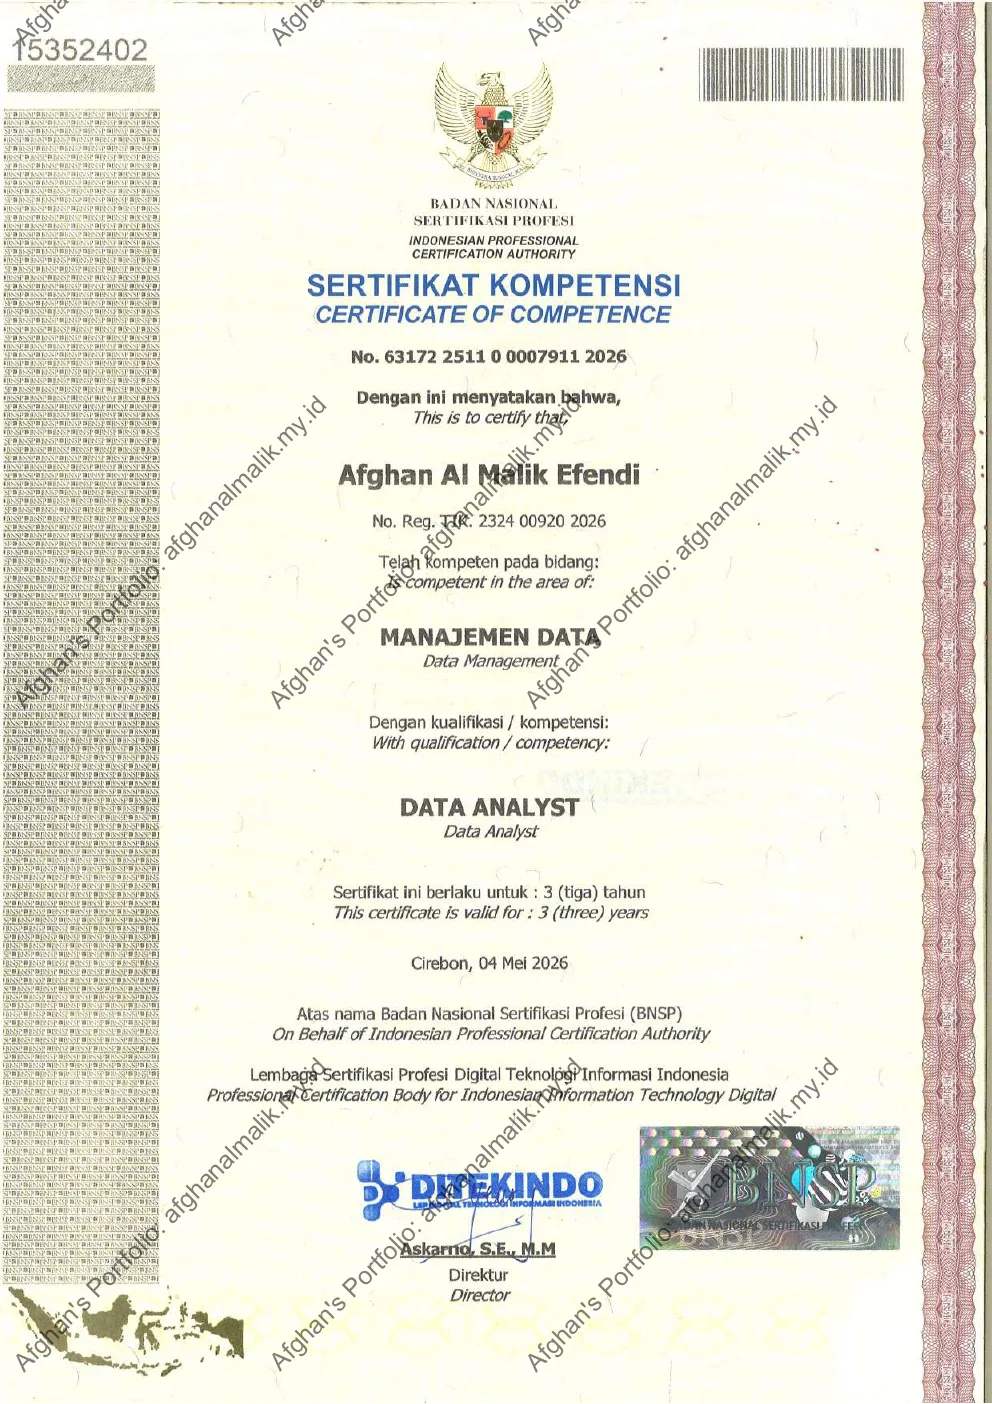

PASAS Institute
February 2024 - February 2027
View credential
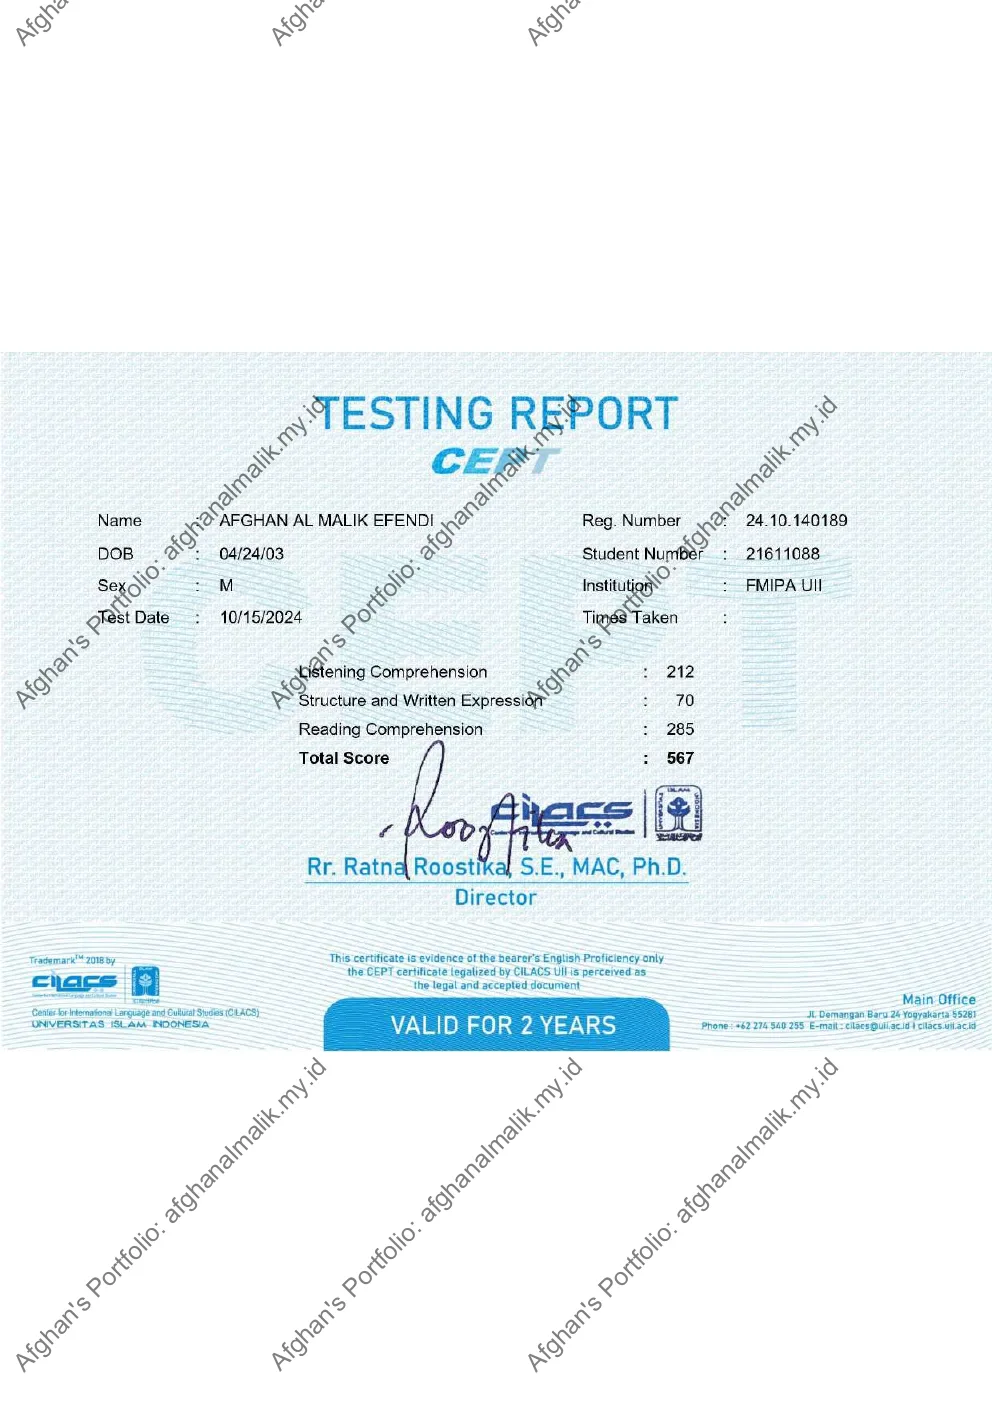

Google via Coursera
Completed June 2026
View credential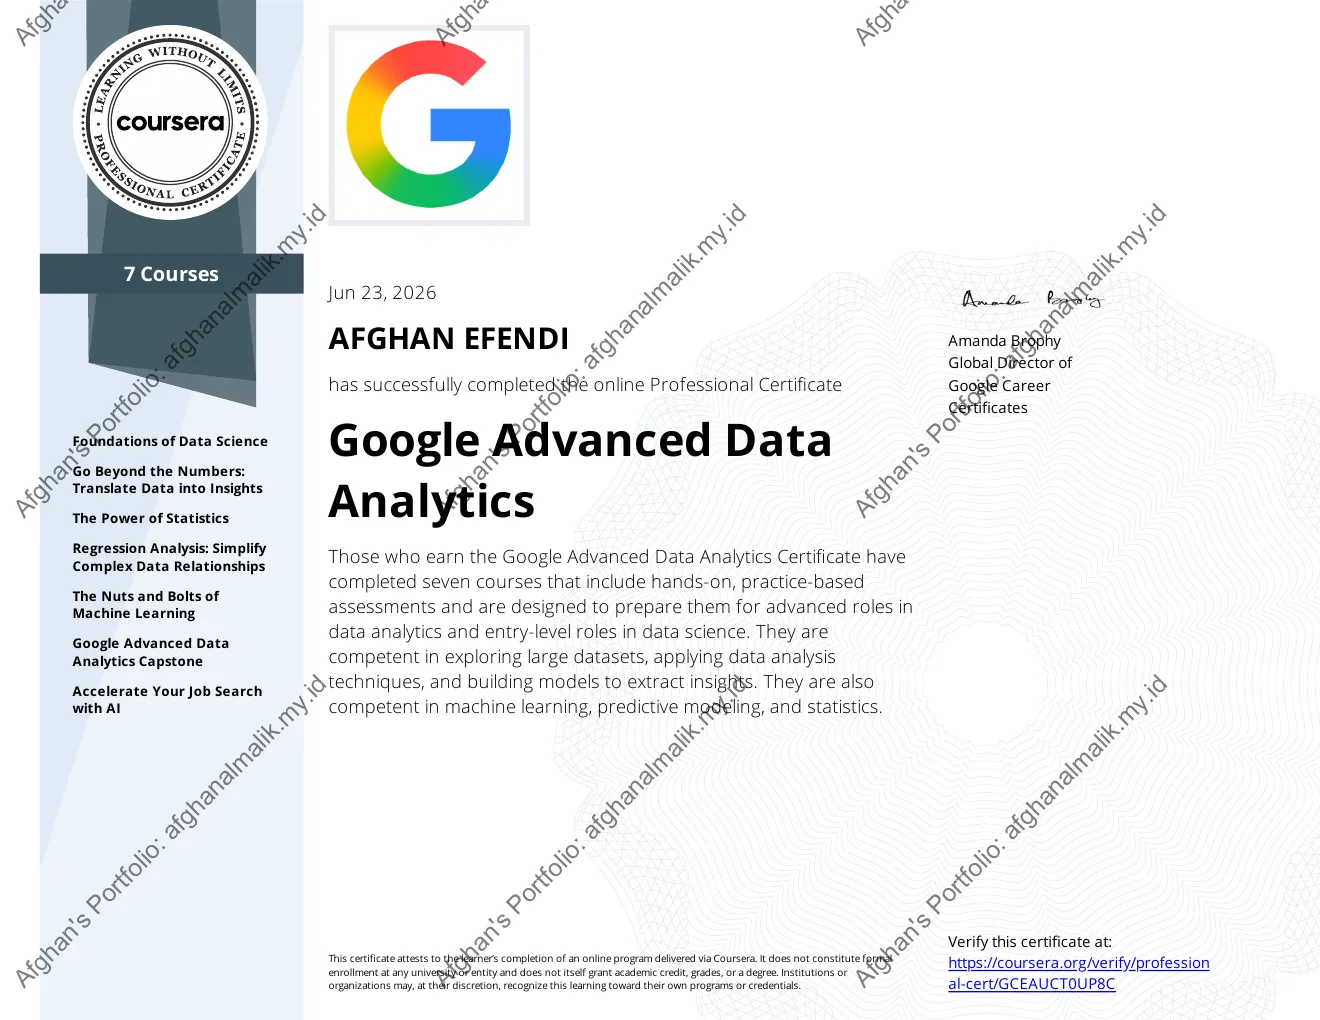


Badan Pusat Statistik Provinsi Jawa Barat
Contributed to statistical application development, industrial data analysis, visualization, and census data processing within the Production Statistics Division.
Key contributions


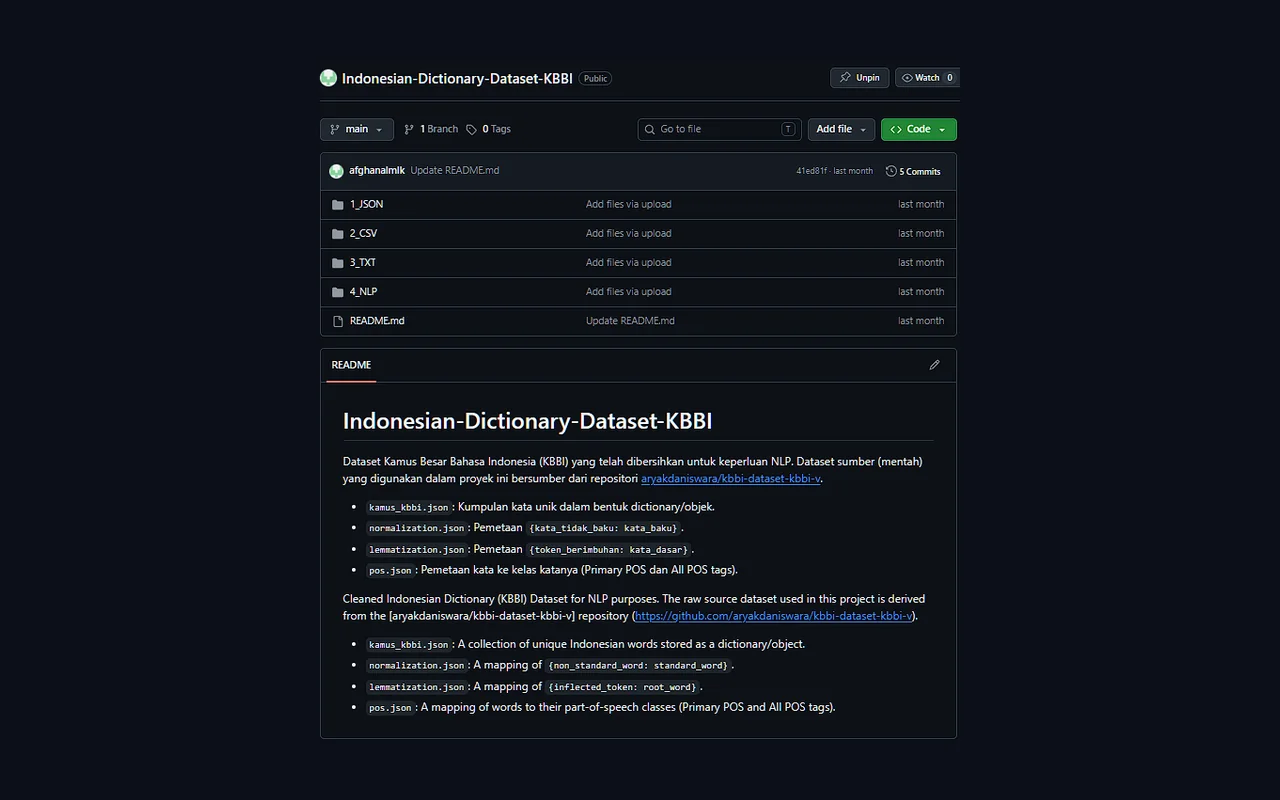
Prepared and structured a cleaned KBBI dataset to support normalization, lemmatization, part-of-speech tagging, and Indonesian-language NLP development.
Problem
The raw dictionary dataset required cleaning and restructuring before it could be used in an NLP pipeline. Vocabulary, non-standard forms, inflected words, and word classes needed a consistent format that researchers and developers could reuse.
Action
Cleaned the source dataset, organized unique vocabulary, and created mappings for non-standard words, root words, and parts of speech. Published the output in multiple formats and documented it in a GitHub repository.
Result
Delivered a reusable KBBI resource containing a unique-word dictionary, non-standard word normalization, inflected-token lemmatization, and part-of-speech mappings. Its multi-format structure simplifies integration into Indonesian NLP preprocessing workflows.

Analyzed tuberculosis risk factors in West Java using the 2023 Indonesian Health Survey, missing-data handling, and survey-weighted logistic regression.
Problem
The analysis had to address missing data and a complex survey structure involving stratification, clustering, and weights. Conventional models could produce estimates and inference that did not properly represent the West Java population.
Action
Compared Simple Imputation, Bayesian Ridge, and Random Forest for missing-data handling. Used the best method before fitting a survey-weighted logistic regression, evaluating calibration and discrimination, and interpreting risk-factor odds ratios.
Result
Random Forest was selected as the best imputation method with a 9.2% MAPE. The survey model achieved good calibration with a p-value of 0.927 and an AUC of 0.736. Household contact with a tuberculosis patient was the strongest risk factor, with an odds ratio of 15.22.
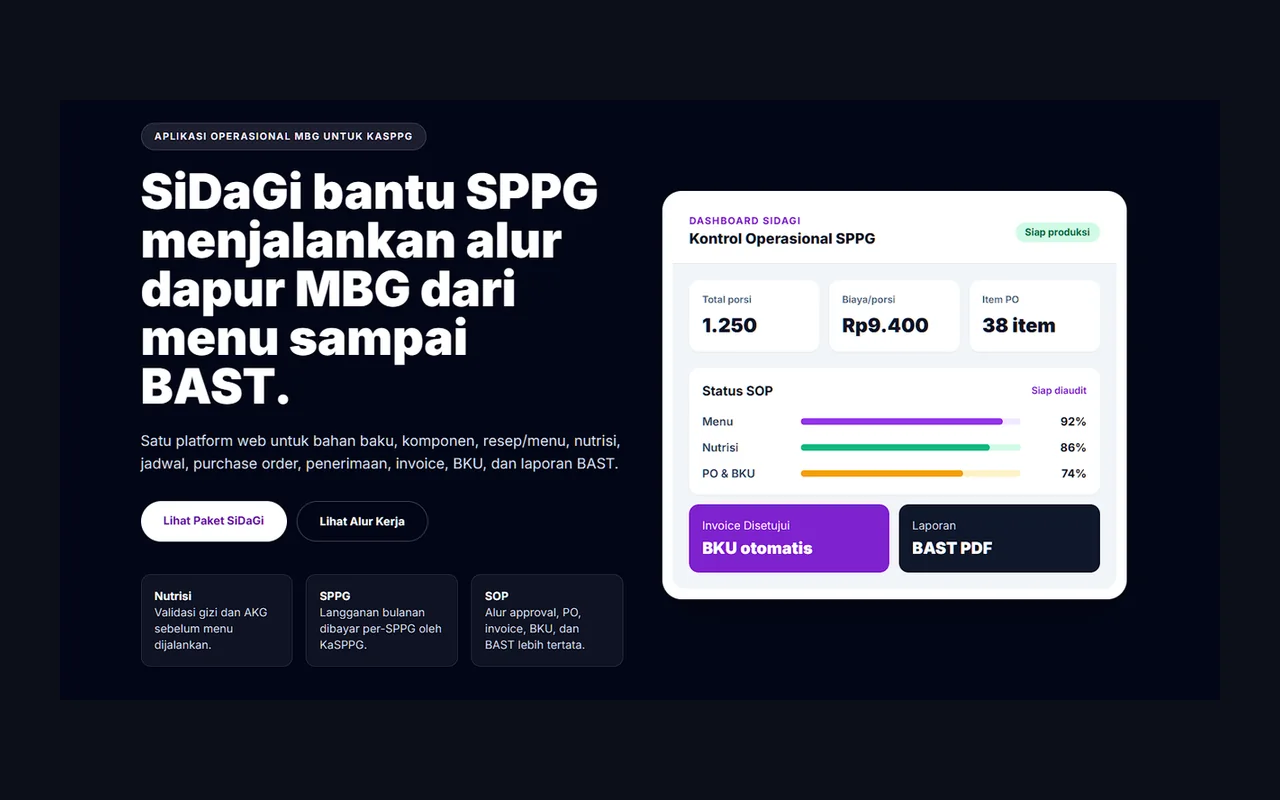
Developed a web application that organizes kitchen operations by integrating data, approvals, procurement, budgeting, and reporting into a role-based workflow.
Problem
Kitchen operations relied on unstructured data and WhatsApp communication, complicating coordination across roles, slowing review and approval, and increasing the risk of miscommunication, recording errors, and budget mismatches.
Action
Built SiDaGi as a centralized platform to replace fragmented manual processes. Implemented role-based workflows, review and approval flows, automated requirements and budget calculations, and document management from menu planning through accountability reports.
Result
Created a more structured operational workflow that brings data, approvals, procurement, and finance into one platform. The system reduces dependence on WhatsApp, accelerates cross-role coordination, lowers budget-error risk, and improves transaction and reporting traceability.

Analyzed 3,400 TripAdvisor reviews to measure visitor sentiment about architecture, activities, cleanliness, accessibility, and pricing at Prambanan Temple.
Problem
Visitor reviews contain unstructured opinions that are difficult to assess manually. A method was needed to group sentiment across five operationally relevant aspects.
Action
Collected TripAdvisor reviews, cleaned and tokenized the text, and categorized sentences by aspect. Analyzed sentiment with the Bing Lexicon and visualized findings using word clouds, grouped bar charts, and a bigram network.
Result
Overall visitor sentiment was positive. Activities received the strongest positive response, while price and architecture recorded the lowest positive sentiment. The findings can support evaluation of ticket pricing, accessibility, and visitor services.
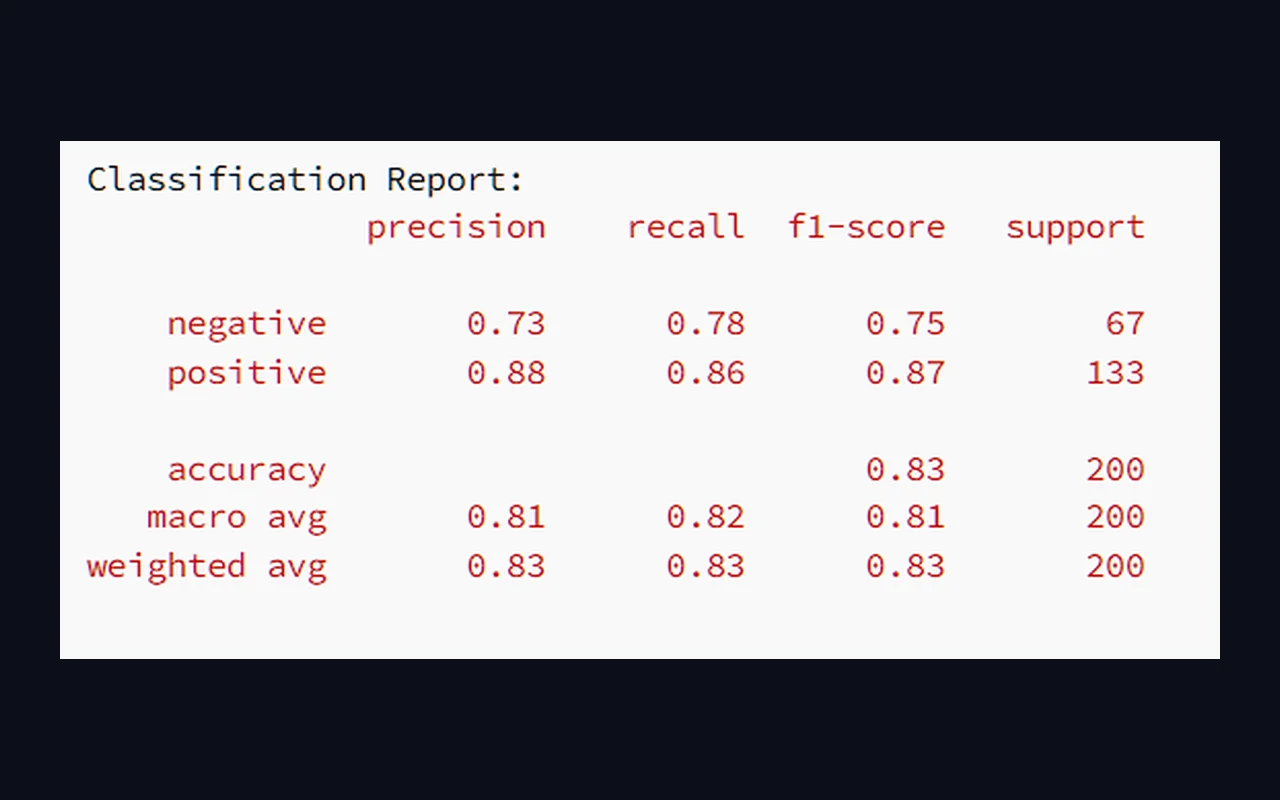
Built a pipeline for scraping, preprocessing, labeling, fine-tuning BERT, and evaluating sentiment in reviews of Mission: Impossible — Fallout.
Problem
IMDb reviews are unstructured and must be collected and cleaned before use. They also lacked sentiment labels, while their contextual nuance called for a transformer model for more accurate classification.
Action
Created a scraper with Requests and BeautifulSoup, then applied tokenization, stopword removal, and lemmatization. Labeled reviews with VADER, split the data into training and testing sets, and fine-tuned BERT using PyTorch and Hugging Face.
Result
The dataset contained 649 positive and 349 negative reviews. The BERT model reached 83% accuracy, with an F1-score of 87% for positive sentiment and 75% for negative sentiment, indicating solid performance with room to improve negative-class classification.
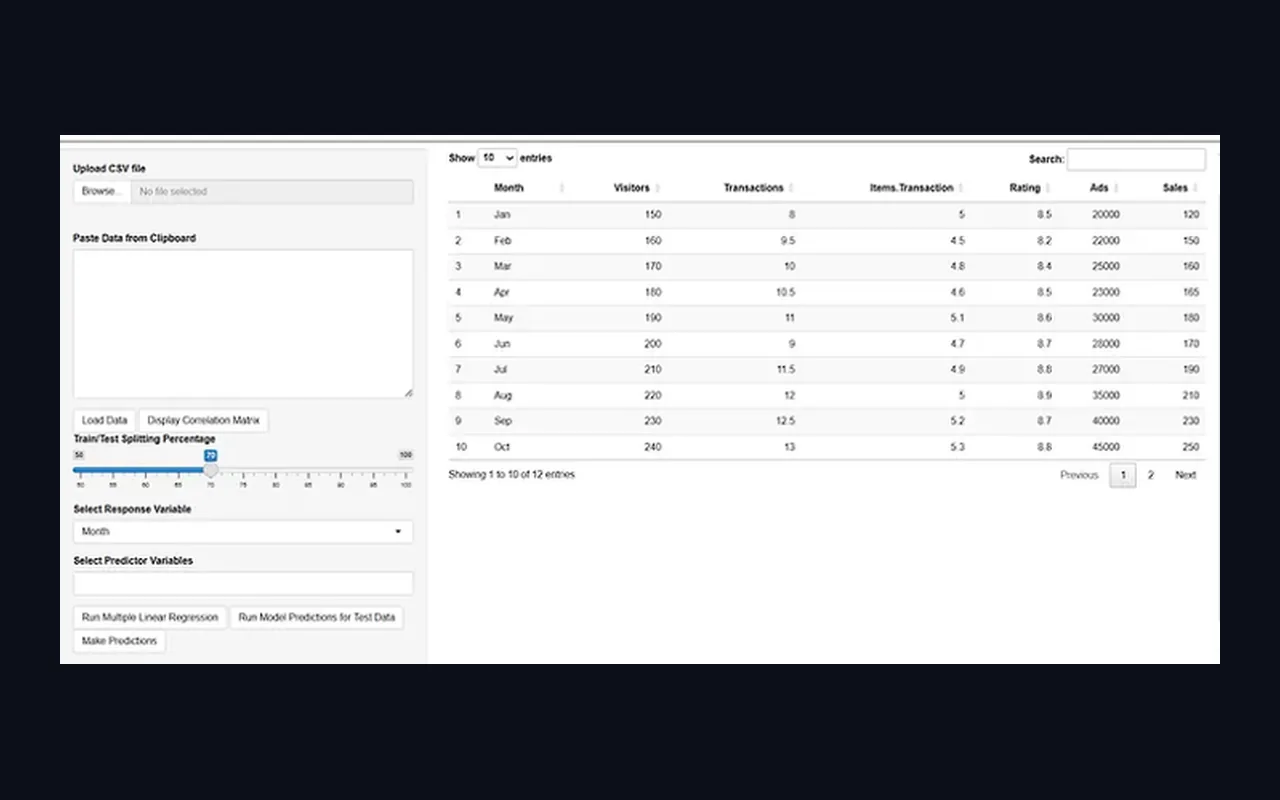
Developed two interactive applications to simplify Multiple Linear Regression and ANOVA, including data input, assumption tests, visualization, prediction, and interpretation.
Problem
Multiple Linear Regression and ANOVA in R require manual variable selection, assumption testing, diagnostics, and output interpretation, creating a time-consuming workflow for users unfamiliar with statistical programming.
Action
Built two R Shiny apps supporting CSV input, variable selection, train-test configuration, correlation matrices, diagnostic plots, and assumption tests. Added regression prediction, ANOVA tables, and Tukey HSD post-hoc analysis.
Result
Both applications ran successfully in dataset testing. The MLR app produced an adjusted R² of 0.9873 and a prediction score of 97.15, although several assumptions were not met. The ANOVA app found a highly significant effect of AdPlacement on CTR, with CenterPage as the best group according to Tukey HSD.
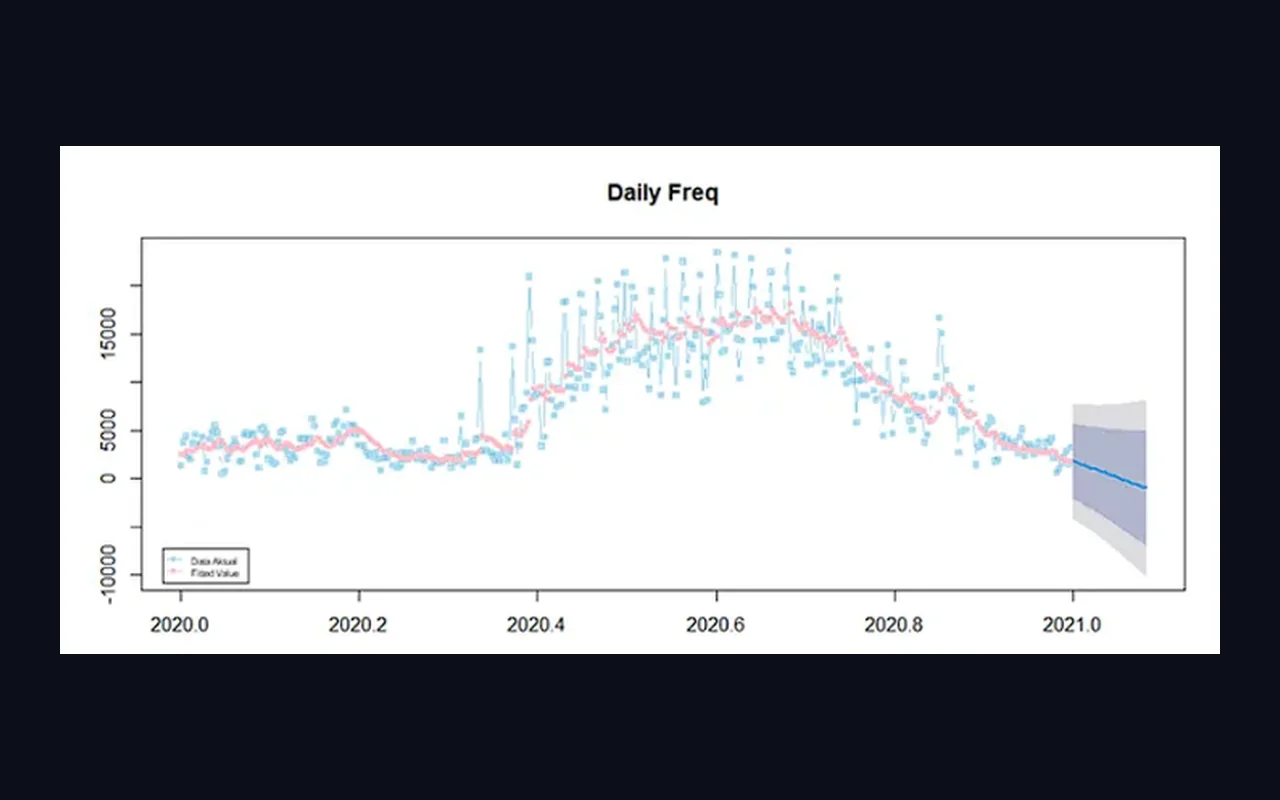
Analyzed 2020 Toronto BikeShare trip data to understand user, bicycle, station, and time-of-use patterns and forecast the following 31 days.
Problem
Trip data was distributed across twelve monthly datasets and covered hundreds of stations and thousands of bicycles. Operators needed insight into usage patterns, fleet effectiveness, station performance, and projected demand.
Action
Combined the monthly datasets, validated missing values, and corrected data types. Conducted descriptive analysis across users, fleets, stations, trip duration, and time patterns, then used Double Exponential Smoothing to forecast the next 31 days.
Result
Usage peaked on Saturdays, in August, and around 5:00 PM. The Holt model produced a MAPE of 38.95%, making it adequate for directional trend analysis and supporting fleet allocation, maintenance, and station development decisions.
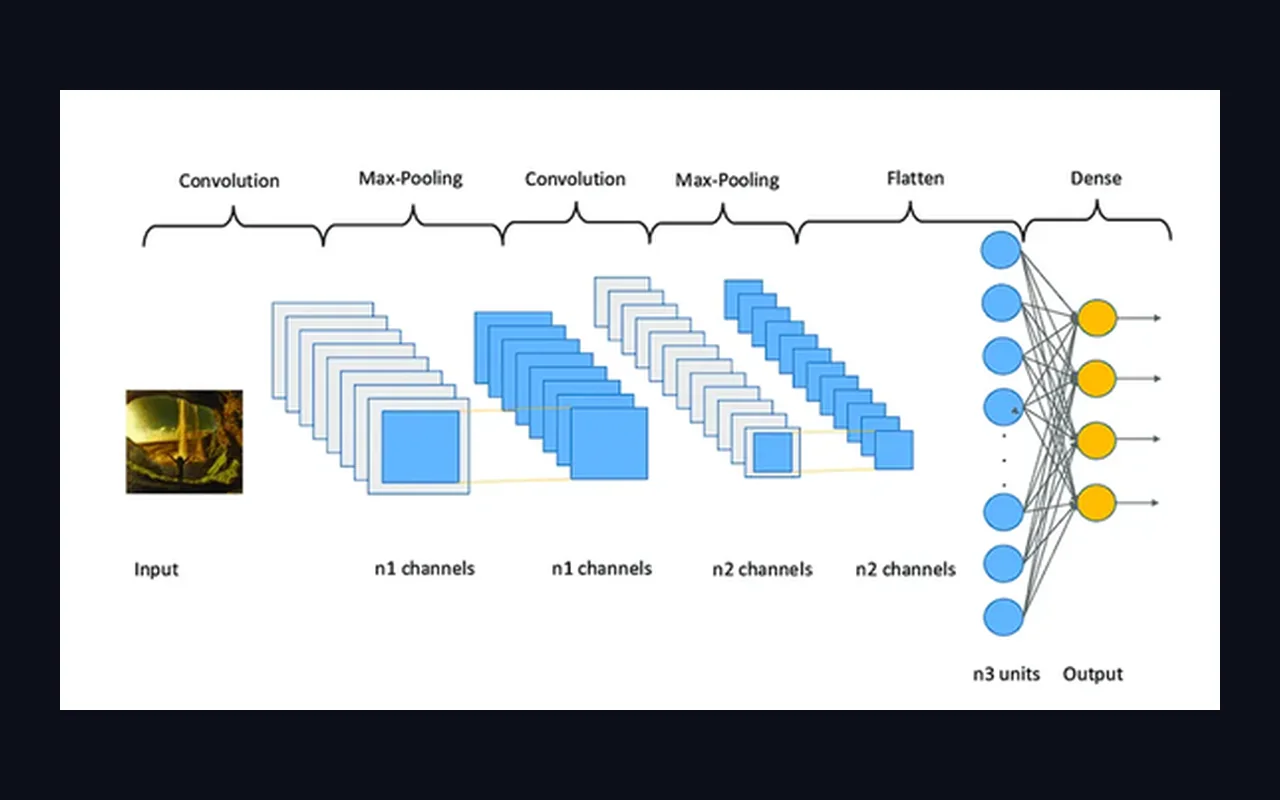
Developed a Convolutional Neural Network to classify images of brooms, ladders, buckets, and frying pans using a dataset available in YOLOv8.
Problem
The model had to classify four household-object categories with only ten images per category. The small dataset increased overfitting risk and limited the model's ability to learn variations in shape, camera angle, and background.
Action
Applied image augmentation and split the data into training and validation sets. Built a model with three convolutional layers, max pooling, a dense layer, and dropout, then trained it with the Adam optimizer and early stopping.
Result
The model achieved 75% validation accuracy, a reasonable result for a very small dataset. In external-image testing, three of four objects were classified correctly, while the frying pan was misclassified as a ladder.